Two Different Ways to Look at Health
In my previous post, I discussed a rising health risk model with a 39% R Squared, which is higher than the R Squared for the best commercial health risk models. I wanted to explain the logic behind this model. The reason for the exceptional accuracy of the rising health risk model is the transformation of the annual increase in spend by using a rank based inverse normal transformation. The theoretical basis for this transformation is that health is normal. I wanted to provide the evidence I had discovered that health is normal.
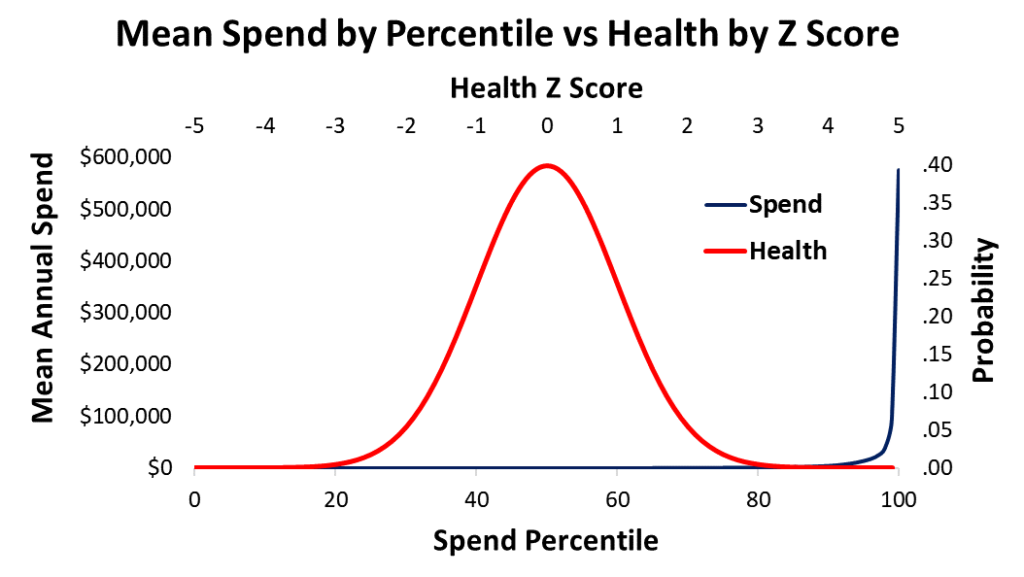
Assuming that I am right, and health really is normally distributed, it would mean that there are two different ways to think about health. One can look at the distribution of dollars spent per patient per year, or one might consider that health is normally distributed. These two versions of health are plotted above.
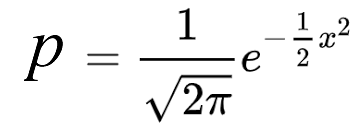
Note that the x axes for the two plots are percentiles and Z scores. The relationship between the percentiles and the Z scores is a negative squared exponential function. This is the formula for a standard normal distribution.
The spend distribution of annual healthcare dollars spent per patient percentile is well known in the healthcare literature. A small fraction of the patients use up a large fraction of the money spent on healthcare each year. In one healthcare system, the average cost per patient in the 99th percentile was $576,000 per year. The mean cost per patient in the 98th percentile was $94,000 per year, and only $34,000 per year in the 97th percentile. The median cost per patient in the 50th percentile was only $94.00 per year. About 45% of the patients seen in the previous three years spent no money on healthcare at all.
The possibility that health is normal seems to have been almost completely ignored in discussions about the nature of health. I tried to Google search this topic and found no substantial mention of this possibility. Part of the problem seems to be that health spend does not look normal. Another problem is probably that health is a latent trait, which means that it can’t be observed directly. That is part of the reason that there are few global measures of health.
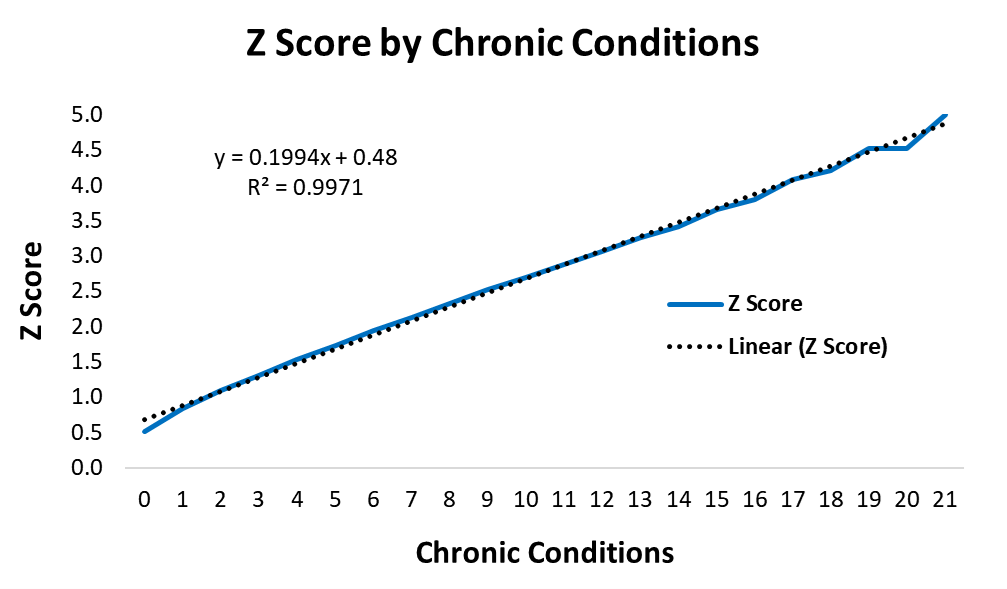
I was able to use the total number of chronic conditions per patient as a global measure of health. When I examined the cumulative distribution of chronic conditions in a healthcare population, the results indicated that health is probably normally distributed. The R-Squared on the Q-Q test for normality was 99.7%.
This suggested that we need to think differently about health. Perhaps it is time to move beyond thinking about the cost distribution as a measure of health and start thinking about the normal distribution as a measure of health. This seems to have important implications for measurement and efforts to change the mean health of populations.
The Evidence that Health is Normal
As mentioned, health is a latent trait, which is unobservable. However, chronic conditions are observable and well defined. The Epic EHR provides a measure of the number of chronic conditions per patient for patients diagnosed with a chronic condition in the past two years. Chronic conditions are things like diabetes, obesity, etc. There are a total of about 45 different chronic conditions one might have.
I collected the numbers of chronic conditions per patient, zero, one, two, three, etc. up to twenty-one chronic conditions for one patient. This data is shown in the table below. I calculated the percentage of patients with each number of chronic conditions and then calculated the cumulative percentages. I used the NORM.S.INV(p) function in Excel to compute the Z scores for the cumulative percentages. Since the Z Score for a 100% probability is undefined, I set the last line to Z = 5.
Chronic Conditions
| # of Chronic Conditions | % | Cumulative % | Z Score |
| 0 | 69.4% | 69.45% | .51 |
| 1 | 10.4% | 79.85% | .84 |
| 2 | 6.28% | 86.13% | 1.09 |
| 3 | 4.30% | 90.43% | 1.31 |
| 4 | 3.22% | 93.65% | 1.53 |
| 5 | 2.21% | 95.85% | 1.73 |
| 6 | 1.50% | 97.35% | 1.93 |
| 7 | 1.00% | 98.35% | 2.13 |
| 8 | .65% | 99.00% | 2.33 |
| 9 | .41% | 99.41% | 2.52 |
| 10 | .24% | 99.65% | 2.70 |
| 11 | .15% | 99.80% | 2.88 |
| 12 | .091% | 99.89% | 3.07 |
| 13 | .051% | 99.94% | 3.25 |
| 14 | .026% | 99.969% | 3.42 |
| 15 | .019% | 99.987% | 3.66 |
| 16 | .0053% | 99.9928% | 3.80 |
| 17 | .0050% | 99.9978% | 4.09 |
| 18 | .00094% | 99.9987% | 4.21 |
| 19 | .00094% | 99.9997% | 4.52 |
| 20 | 0% | 99.9997% | 4.52 |
| 21 | .00031% | 100% | 5.00 |
I plotted the Z scores for the cumulative percentages in Excel and tried to fit a linear model to the line. This is the equivalent of the Q-Q plot provided by many statistical packages. The Z Scores are Quantiles and should follow a straight line if the distribution is normal. The R-Squared for the fit between the Z scores and a straight line was 99.7%. This suggested that health risk is normally distributed.
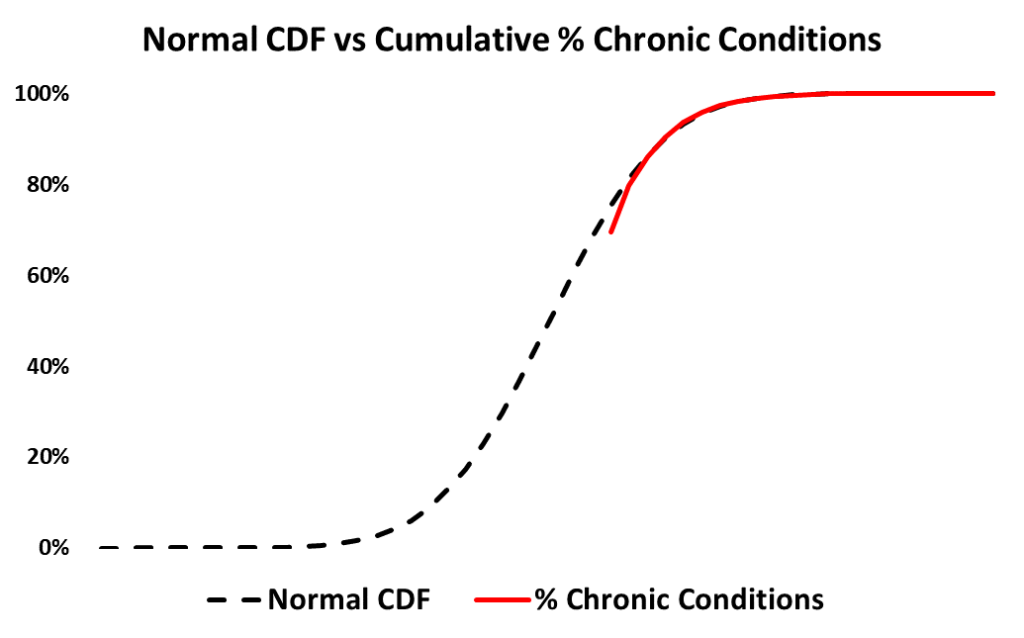
The formula for the Normal Cumulative Distribution Function (CDF) is an integral function of a negative squared exponential function. This produces a sigmoid (S Shaped) curve.
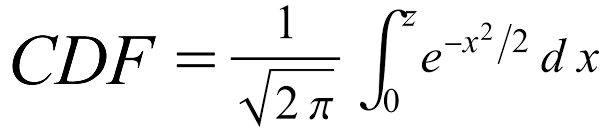
As another check, I plotted the relationship between the cumulative percentage of chronic conditions and a normal cumulative distribution (CDF). There seemed to be a fairly close fit, also around a 99% R Squared.
Why is this Important?
While this one set of statistical analyses does not prove that health is normal, the evidence strongly suggests that this is the case. Why might this be important?
This seems to be important because it suggests that the annual healthcare spend is generated from a population where health is normally distributed. I reasoned that it should be theoretically justified to convert the annual patient spend to Z scores using a rank based inverse normal distribution. See the article “Rank-Based Inverse Normal Transformations are Increasingly Used, But are They Merited?” for a good overview.
When I did, the R Squared for the risk prediction model I had developed jumped from 26% to 39%. This was a 50% increase in explained variation. This result provides additional evidence that health is normally distributed. Assuming that health is normally distributed provides a substantial increase in the ability to predict health problems.
